ChatBCG - Can AI Read Your Slide Deck?
Don't fire your Consultants or Product Managers just yet-- AI isn't quite ready to read slide decks

Rob Balian
CTO
This is our first research paper at Reprompt. We think vision is one of the last unlocks towards AGI, and we're using AI vision to read the world's unstructured data like PDFs and Slide decks
Methods
We ran Gemini Flash and GPT 4o-- 2 of the latest multimodal models as of July 2024--through a test set of slide decks featuring charts and figures you'd see in a business presentation. Everything from simple charts with obvious labels, to complex ones with multiple series and unlabeled datapoints requiring estimation.
We prompted the models with simple, quantitative questions about what data was represented by the chart. We chose not to include more subjective questions like "what is the trend" or "is this business performing well."
The full dataset with chart images is available here
Results
GPT and Gemini absolutely ace very simple charts with obvious labels. But add another axis or make them estimate a value? They happily hallucinate with high confidence. In our labeled charts dataset, GPT and Gemini answered incorrectly on ~50% of the slides.
If you asked AI to read a deck today, it would hallucinate on roughly half the slides.
Neither model significantly outperformed the other across the vision tasks. Both models understandably performed worse on unlabeled charts where estimation was required. However, benchmarking human estimation at ~10%, GPT and Gemini still had far higher error rates on unlabled charts than labeled ones.
Weirdly both models also mixed up 3s and 8s on similar charts. However we could mostly solve this hallucination with explicit prompting:
Prompt engineering at its finest
Intuition on Vision in LLMs
Multimodal LLMs seem to struggle with charts in a simlar way to humans. More entropy in the chart or more data points result in higher error.
We also found that intuitively, putting important elements physically further from each other increased error rate-- for example, for a chart with a legend at the top, the models hallucinated more on values that were near the bottom of the chart.
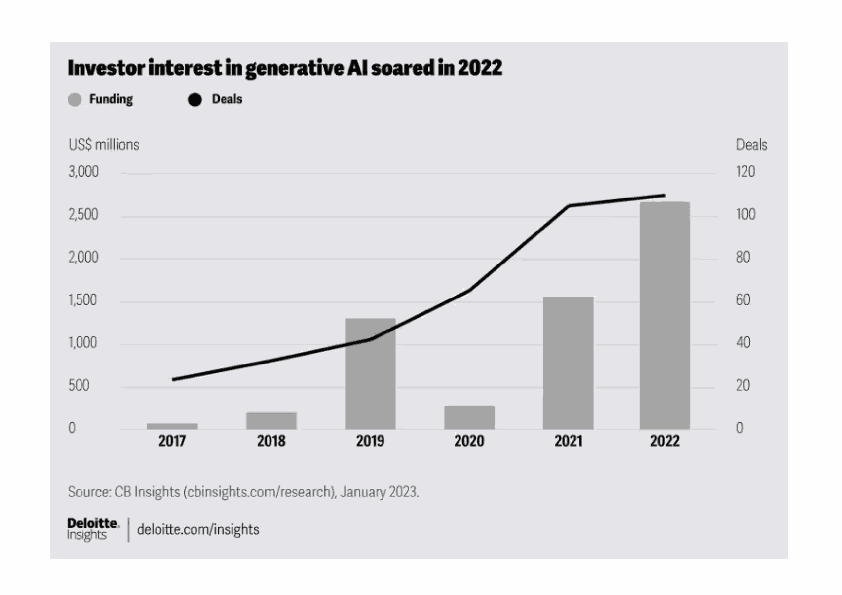
Similarly we found that needing more lookups or "hops" to get to data points increased error rate. For example. In the chart below, "how many deals were done in 2018" would cause a human to look first at the legend to find "deals" then at the black line, and finally at the axes to determine which y axis corresponded to deals. That's a lot of "hops" for a model to have to go through. We expect that agents will help solve this problem.
Examples

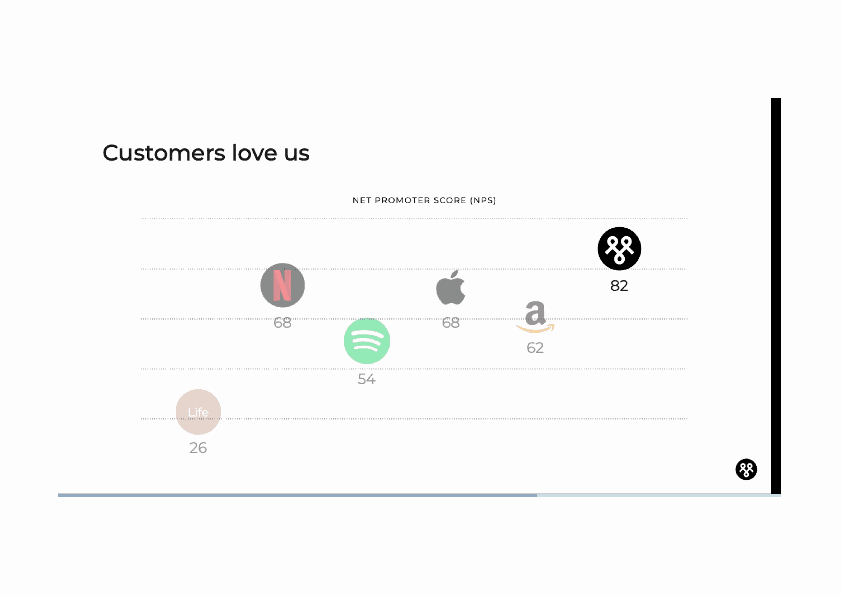
Unsurprisingly both GPT-4o and Gemini answered all questions correctly for this chart

Both models struggled estimating the value of this chart
Why does this matter?
I've got stats for you
80% of the world's data is unstructured
There are an estimated 2.5 Trillion PDFs
30 million slide decks are made daily
This is a TON of data that is currently inaccessible to most data systems. It's human readable only. LLMs are finally making that way more accessible.
Ongoing research
We're going to be doing more research at the intersection of business and AI. If you're interested in collaborating or have a tough business problem, let's chat.
You can find the full paper on ArXiv here.
